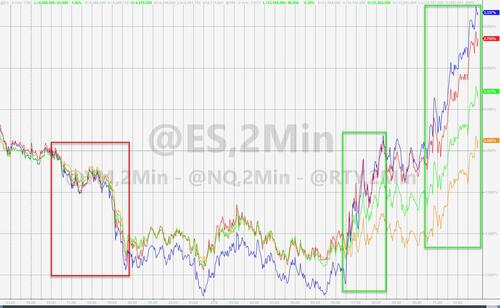
As we noted earlier, today’s stunning rebound in stocks (most notably Nasdaq, which swung from down 4% overnight to close up 3%)…
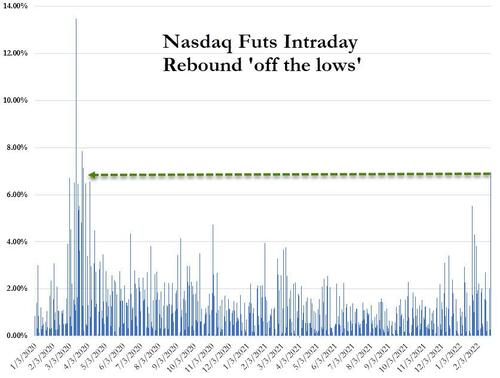
…was the biggest intraday rebound since The Fed ‘saved the world’ in March 2020.
The reversal began at the US cash market open, stalled a little, then exploded higher after President Biden’s sanctions speech was not as harsh as feared.
The question is – WTF Happened!!!
We offered some preview hints on Tuesday when we noted that market sentiment has barely ever been worse and everyone is hedged-and-wedged…
Everyone is hedged for a crash: "we have been averaging $1 Trillion worth of puts per day. Largest on record." – GS pic.twitter.com/zRrpCgbJYZ
— zerohedge (@zerohedge) January 31, 2022
But, as always, SpotGamma has the detailed answer of what drove today’s shocking swing (and why it may not last)…
On Thursday 2/24 the market opened down nearly 2.5% on news that Russia had invaded Ukraine. Off of that opening low, the S&P500 staged a remarkable 4% intraday rally, moving from a low of 4114 to a high of 4294.
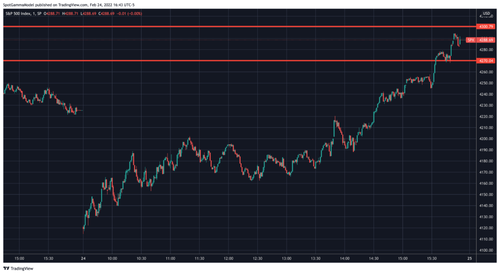
So, what caused this rally? Short covering.
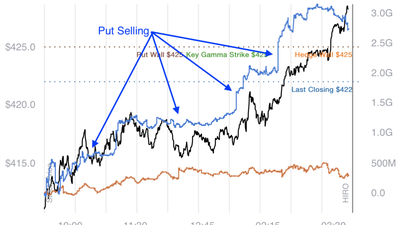
Below we’ve posted our HIRO chart of SPY (black line) from 2/24. The HIRO system tracks the estimated dealer hedging impact of options that are being bought and sold throughout each day. As you can see we’ve broken this out by put options flow (blue) and call flow (orange). HIRO is tied to the right Y axis, and is a dollar notional estimate of hedging flow.
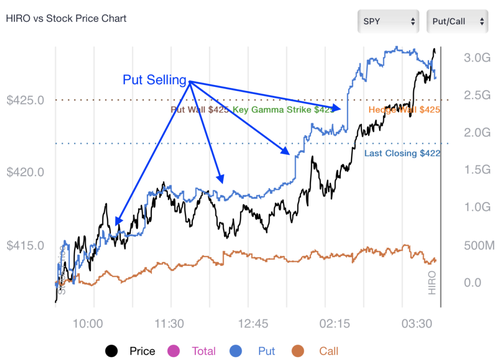
The fact that these put & call lines are both higher tells us that traders sold puts and bought calls.
The act of selling puts and buying calls generates positive deltas for options dealers, which implies dealers need to buy stock as a hedge.
You may note that the put flow was nearly 6x larger than the call flow.
Its most likely that traders entered the day LONG these put options, and so they likely are selling puts to close.
Accordingly, its likely options dealers started the day short puts, hedged with short stock. As a result, as puts are sold/closed dealers are buying back those puts and buying back their short stock hedges.
This is why we classify today’s rally as “short covering”.
Put covering may generate rallies that are less stable, and more susceptible to mean reversion. This is because once put covering is done, the associated buying flow turns off.
Had call buying been the primary source, dealers would be short calls and hedging with long stock. However, call buyers foist additional buying obligations on dealers through gamma hedging. As the market goes higher, dealers must keep buying stock to maintain the hedge on their short calls. This can help to sustain rallies.
If these delta & gamma concepts are new to you, we suggest you check out our comprehensive options course called The Hedge.
Via Zerohedge
